
Tailored Education
https://tailored.education
Bridging Gaps, Building Futures: Tailored Education in STEM
Throughout the 1990s and 2000s, active learning began to attract increasing attention in STEM fields in response to demands from industry to produce more STEM graduates by - among other things - improving recruitment and retention in STEM undergraduate programs. Funded by large grants from the NSF and other agencies, STEM faculty began large controlled experiments testing the impact of specific active learning methods like demonstration predictions, think-pair-share, minute papers, strip sequences, student-generated test questions, et cetera in entry-level courses in disciplines like physics, biology, and math, which flip the classroom by replacing traditional lectures with student activities which test and apply students' growing understanding of course content.
The project delves into the realm of STEM education, where traditional teaching methods often prioritize lecture-based instruction over interactive learning approaches. Writing Across the Curriculum (WAC) initiatives seek to bridge this gap by integrating writing and literacy activities into STEM courses, aiming to enhance student comprehension and engagement. However, the extent to which these pedagogies are utilized in STEM education and their impact on student performance, especially among underrepresented groups, remains uncertain. Through a rigorous examination of 18 STEM courses at a private liberal arts university, the study employs innovative empirical methods to reassess the efficacy of WAC pedagogies in STEM disciplines.
Utilizing real-time classroom photography and advanced machine learning algorithms, the project analyzes the prevalence of different teaching activities within STEM classrooms. This approach allows researchers to identify patterns in instructional methods and their associations with student course performance. Notably, the study reveals that while traditional lecture-based teaching continues to dominate STEM education, certain active learning pedagogies, such as discussion and group work, yield mixed results in terms of student outcomes across different demographics. Moreover, the research underscores the rarity of WAC pedagogies like reading and writing in STEM courses but identifies them as positively correlated with improved student performance.
Overall, the project advocates for the prioritization of equitable educational practices within STEM disciplines. By providing insights into the utilization and impact of WAC pedagogies, the study aims to inform future teaching strategies that better cater to the diverse needs of students in STEM fields. Through its findings, the project underscores the importance of fostering inclusive learning environments and suggests avenues for further research to advance equitable STEM education practices.
While this project was collecting data to feed into the machine learning image recognition algorithm, an online tool was needed so that professors could access this data.
For this project, I took on the role of UX Researcher and UX Designer. I conducted user research using the professors at our school while looking at other similar projects that were available at other colleges and universities. I also defined the product with deliverables such as a user personas, while ideating designs, conducting usability tests, and applying revisions.
As part of the competitor or landscape analysis, we researched similar projects and sites to understand where TailorEd stands in the market and to see the strengths and weaknesses of our competitors. We looked at a variety of factors including the purpose of the tool, cost to use, target audience and more.
| UBC Grades | Atlas | Berkeleytime | |
|---|---|---|---|
| Cost | Free | Free for Students, Staff & Faculty | Free |
| Target Audience | Professors | Professors & Students | Students |
| Purpose of Tool | To view and visualize historic grade distribution of courses at the University of British Columbia Vancouver and Okanagan, dsplaying grade reports in a more useable manner than what is officially provided by UBC and reporting older grade data that has been removed from public access | To display historic data about curriculum to guide University of Michigan students, instructors, and staff in decision making | To help students view and compare grade distributions for each course and semester and to track accurate, real-time course enrollment trends and history |
We interviewed a total of ten professors at SCU to better understand how they design their course curriculum and how useful they would find a tool like ours.
With these objectives in mind, we aimed to answer the aimed to discover how professors would answer the following questions:
Below are a few highlight quotes from the interviews that we conducted.
"I'm interested in understanding student socioeconomic backgrounds and how this affects student learning (how they learn and whether they choose to learn)."
"I prefer to make minor changes every quarter rather than a massive reconstruction of my course."
"Professors ideally try to mix [classroom] activities, it could be hard to implement because some classes have fixed seating arrangements."
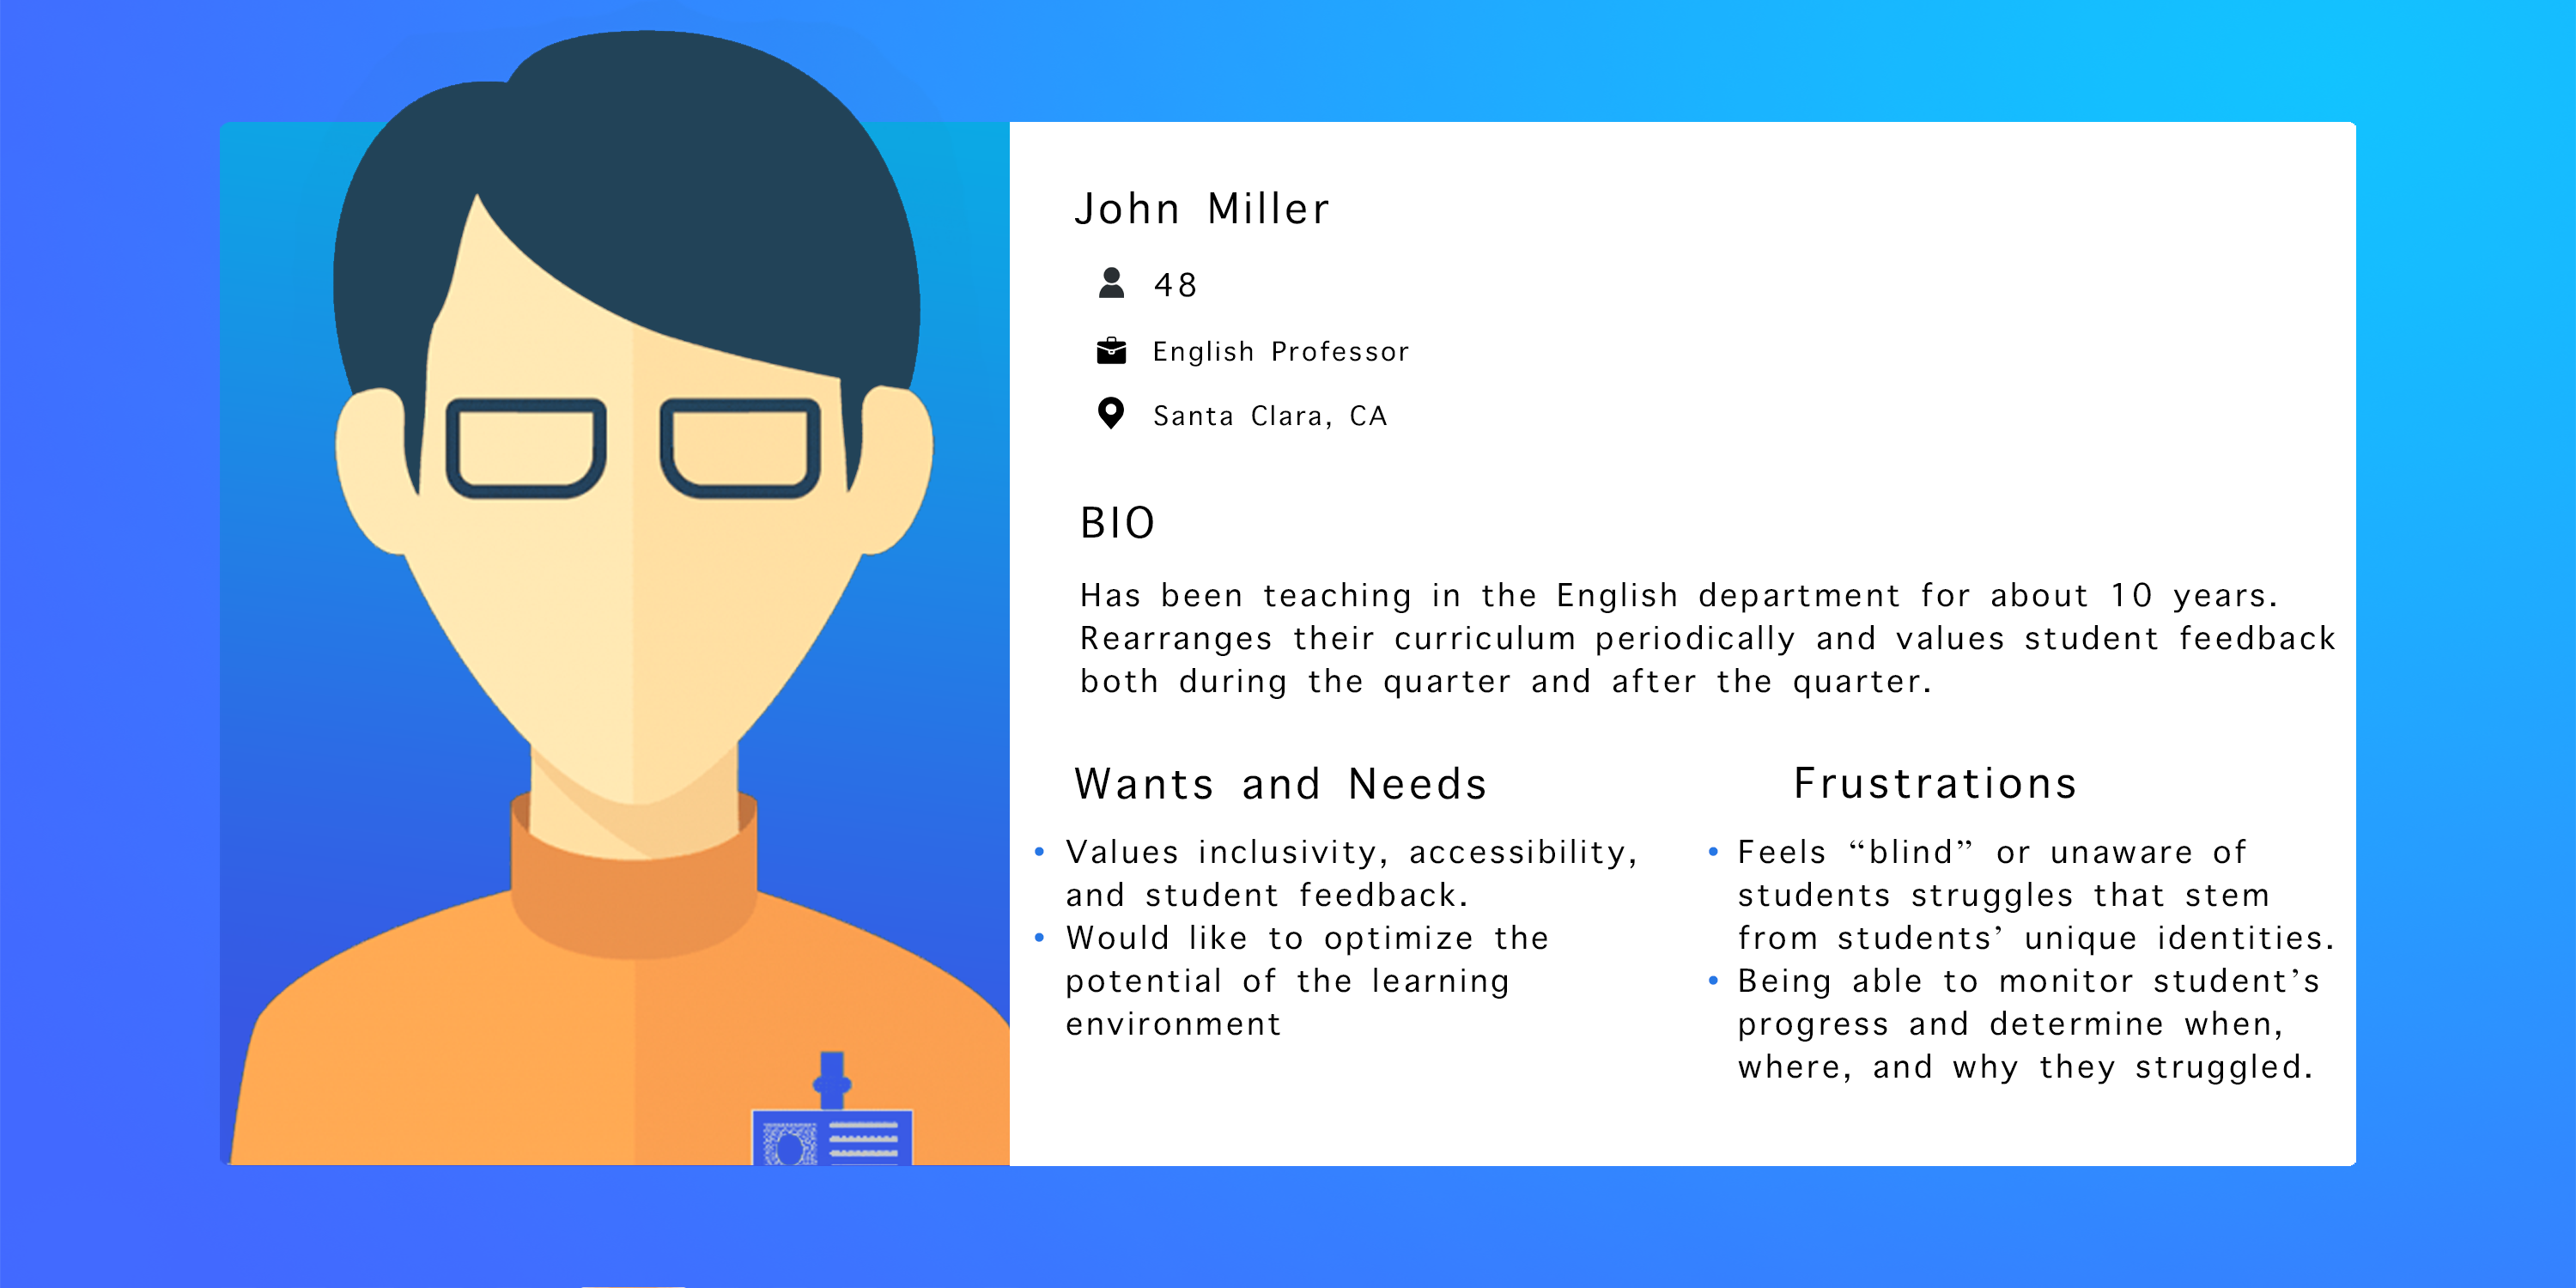
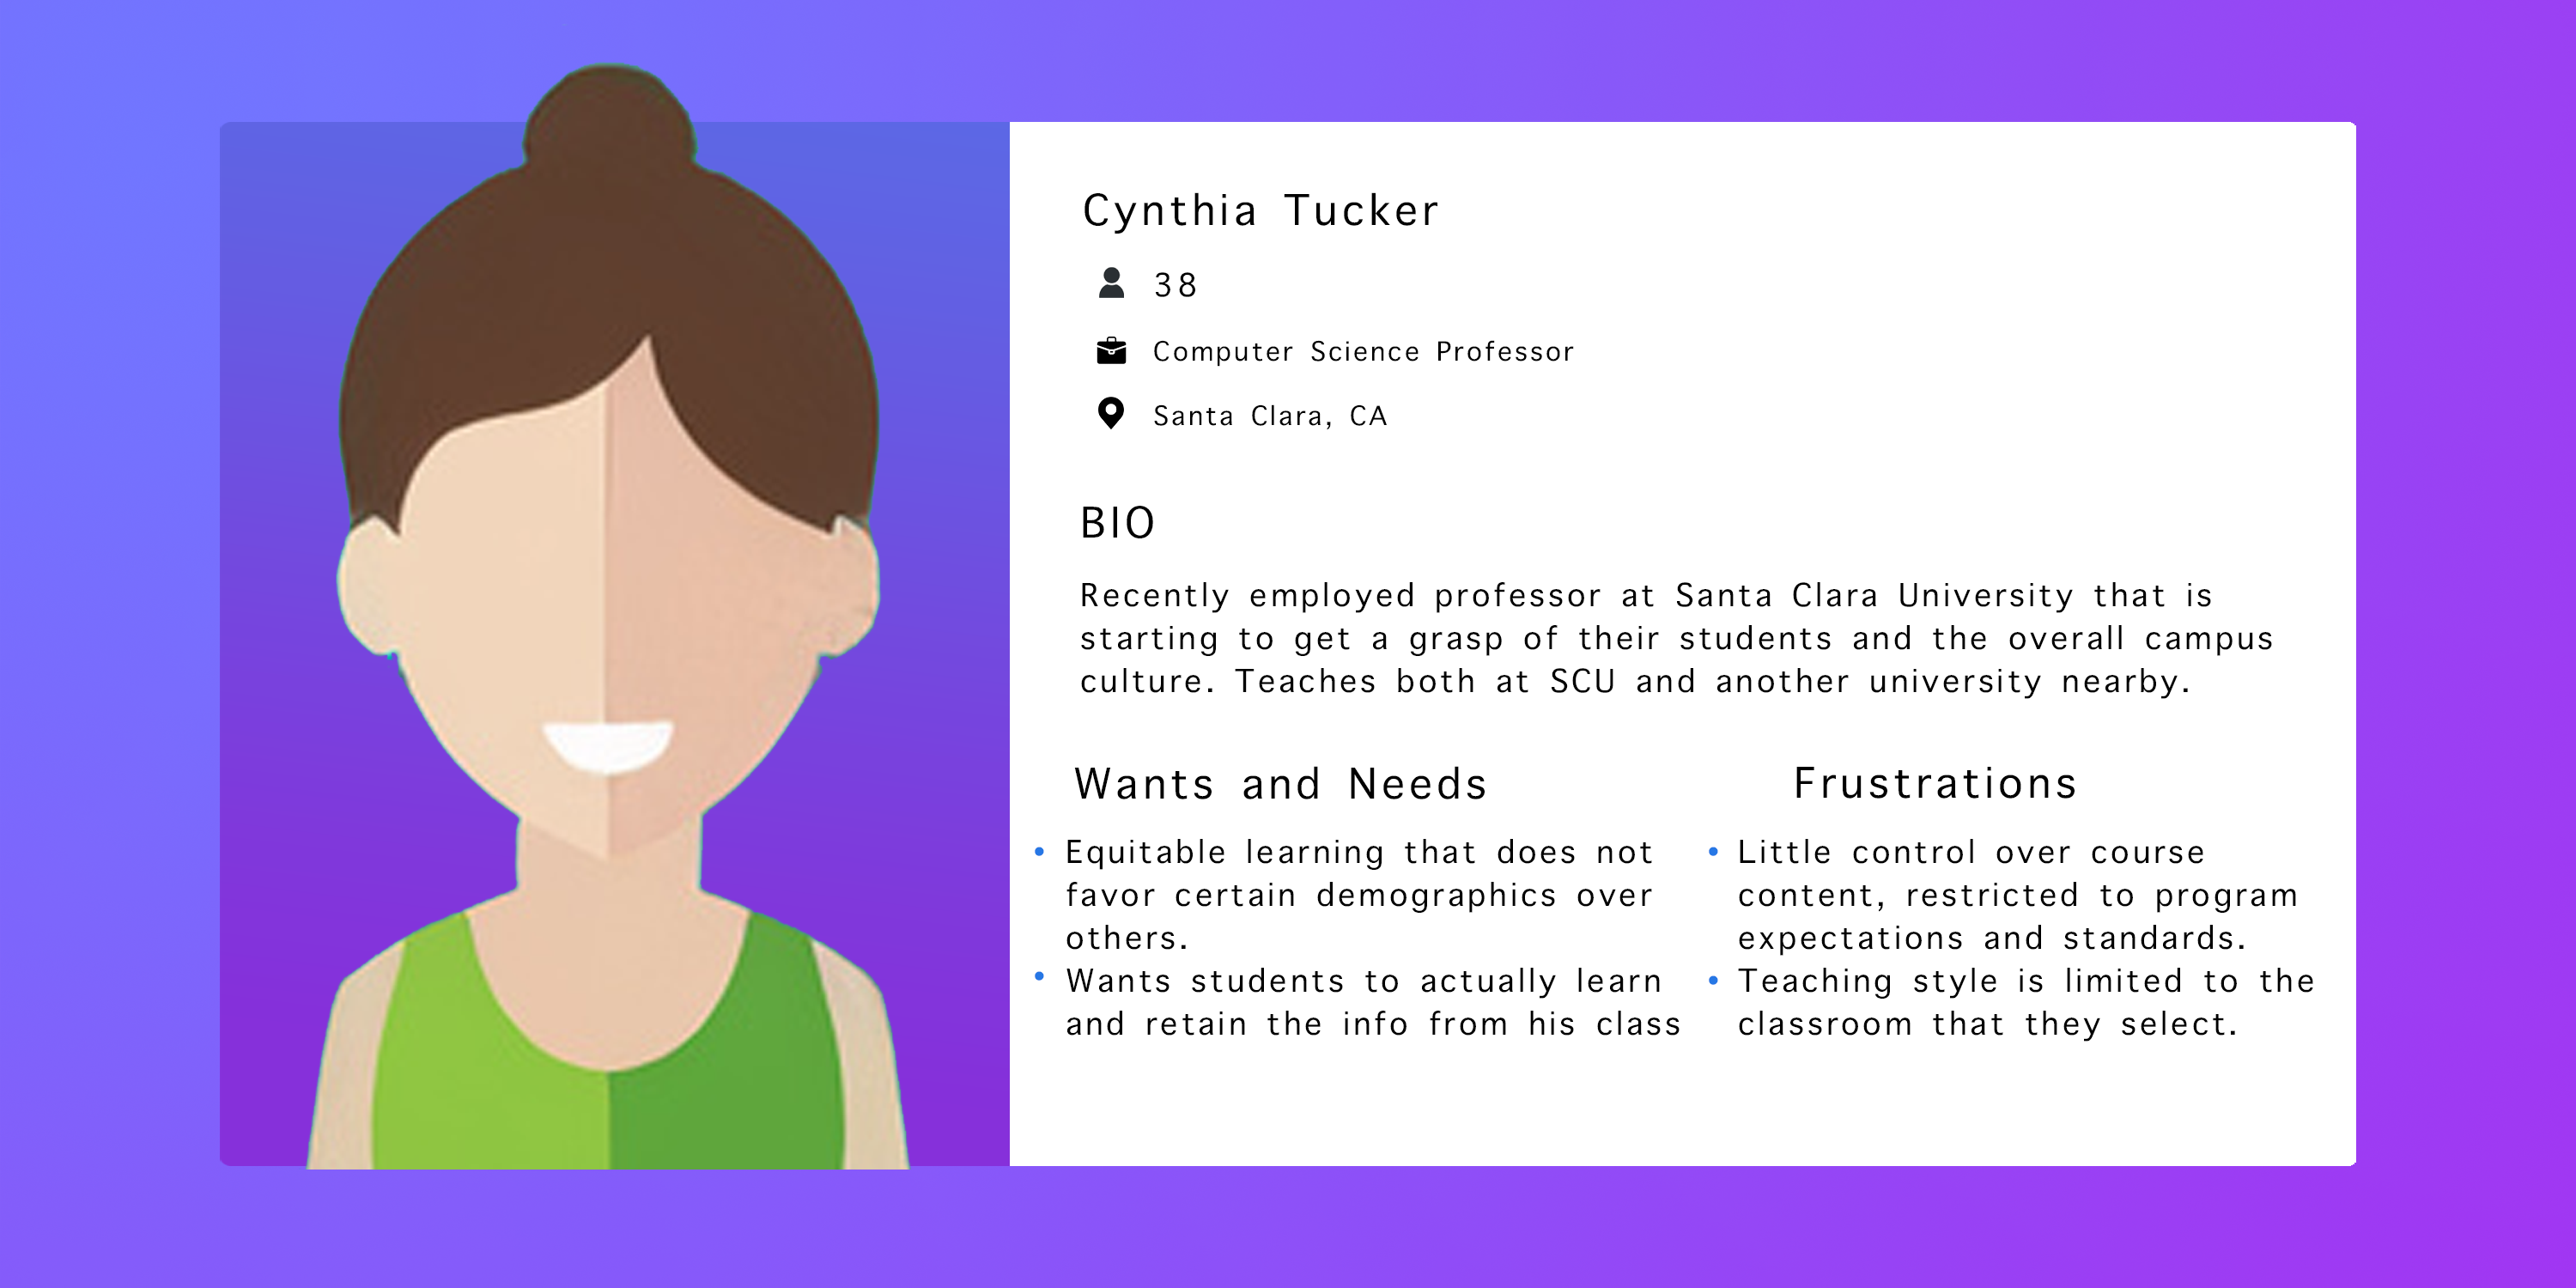
Using the information from both the competitive landscape analysis and the user interviews, I needed to build a few user personas to get a better grasp of the type of user that we are designing for and their needs and frustrations.
Based on the research findings, I created John Miller and Cynthia Tucker - with goals and characteristics that represent the needs of the larger group. With their goals, needs, frustrations, and fears in mind, I have a better understanding of who we will be designing for.
With the research that we had conducted in mind, we wanted to make sure that we covered the following questions:
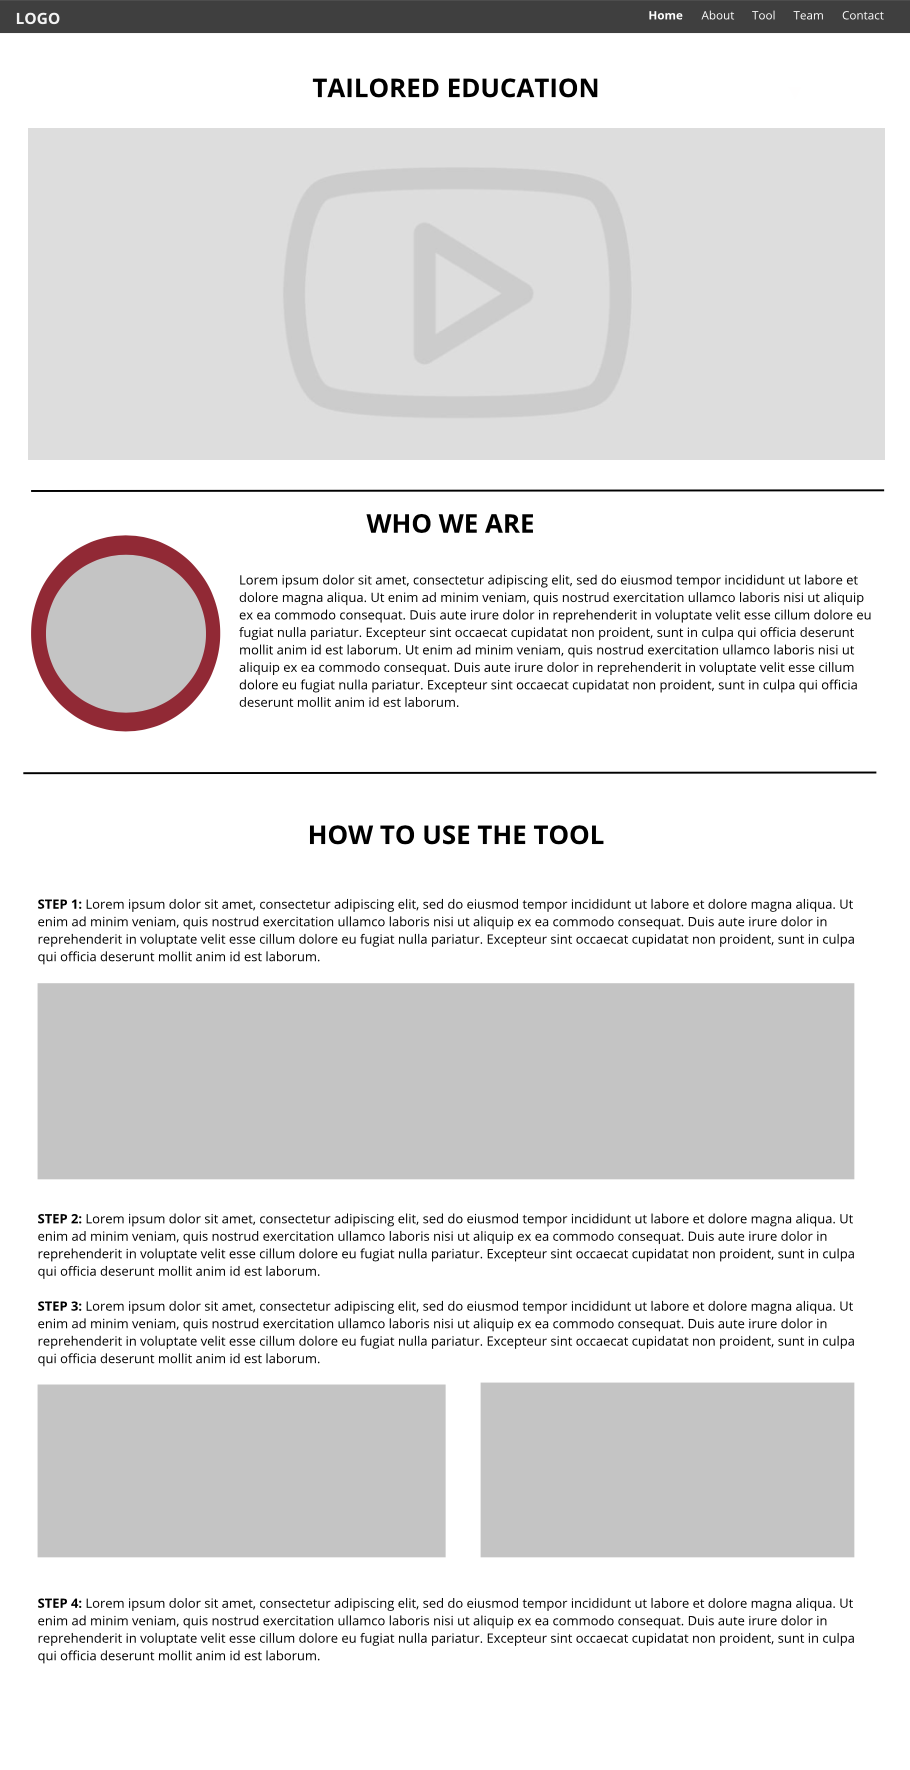
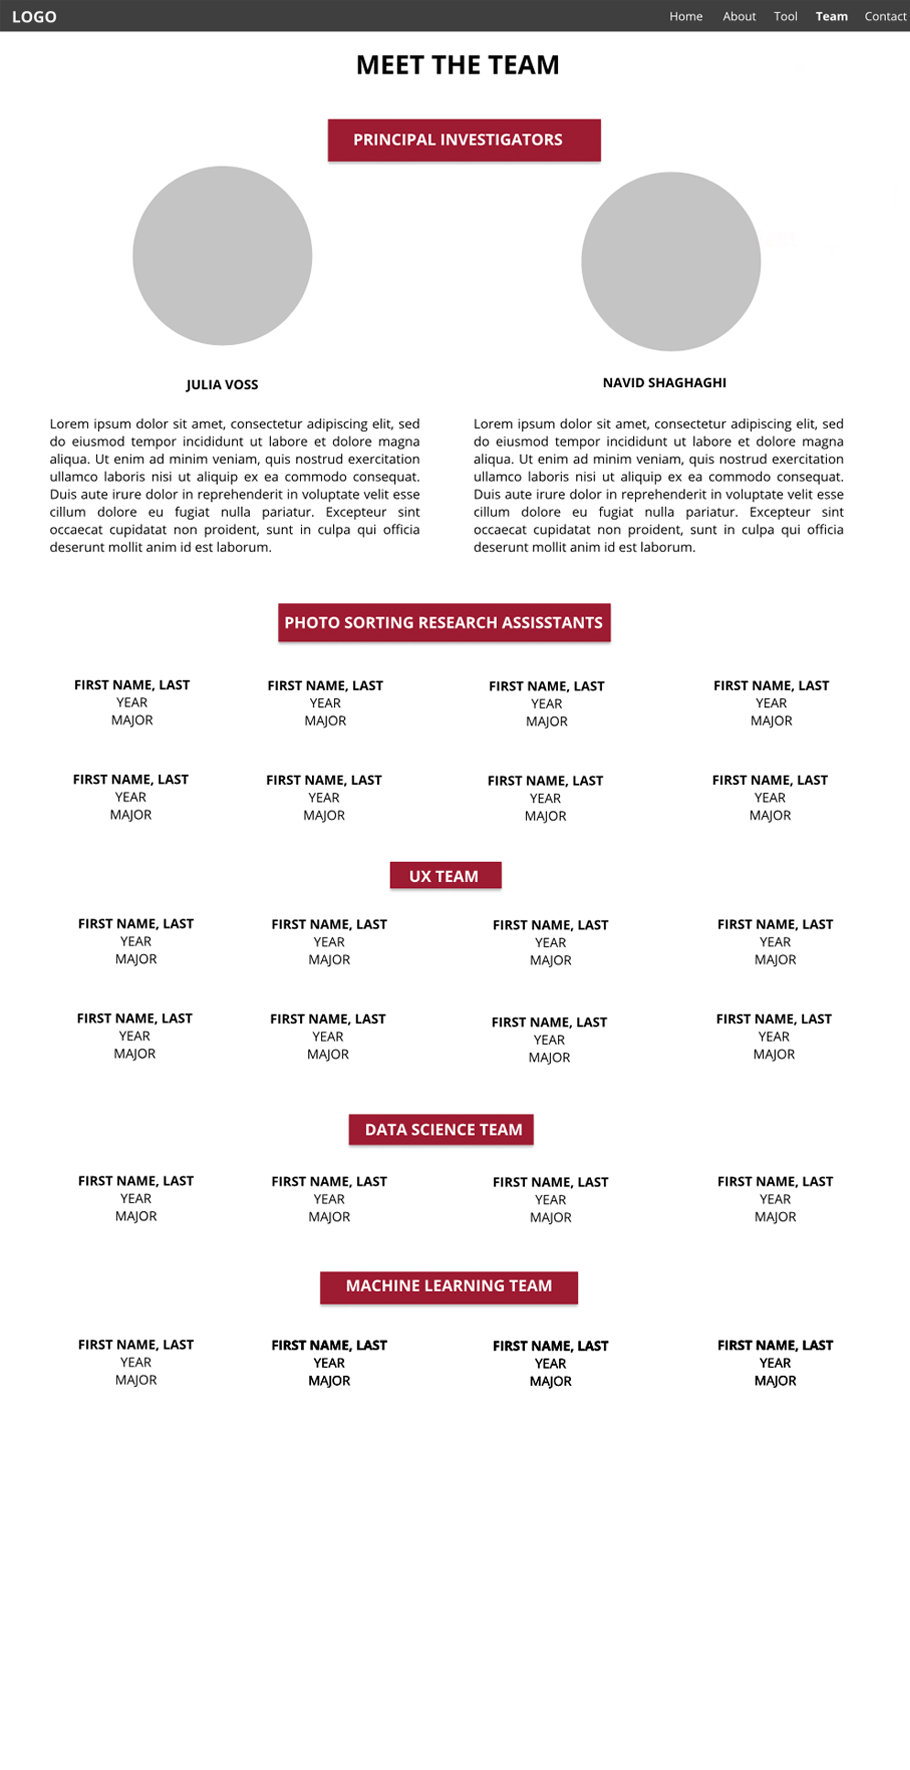
Using those guiding questions, we began to build our initial low-fidelity prototypes of the tool using Figma:
Click the website to check for updates on the project.
https://tailored.education
Watch the presentation of the TailorEd project at the Course Hero Education Summit which our team presented virtually in September 2020.